Archive for July 1st, 2009
A new way to select among FLOSS packages: the FLOSSMETRICS approach
Posted by cdaffara in OSS adoption, OSS business models on July 1st, 2009
One of the “hidden” costs of the adoption or migration to FLOSS is the selection process – deciding which packages to use, and estimating the risk of use when a project is not “mature” or considered enterprise-grade. In the COSPA migration project we found that in many instances the selection and evaluation process was responsible for 20% of the total cost of migration (including both the actual process, and the cost incurred in selecting the wrong package and then re-performing the assessment with a new one).
The problem of software selection is that there is a full spectrum of choices, and a different attitude to risk – a research experiment may be more interested in features, while a mission-critical adoption may be more interested in the long-term survivability of the software they are adopting. For this reason many different estimating methods were researched in the past, including EU-based research projects (the QSOS method, SQO-OSS, QUALOSS) and business-oriented systems like OpenBRR or the Open Source Maturity Model of CapGemini. The biggest problem of those methods is related to the fact that the non-functional assessment (that is, estimating the “quality” of the code and its community and liveness) is a non-trivial activity, that involves the evaluation and understanding of many different aspects of how FLOSS is produced.
For this reason we have worked within the FLOSSMETRICS project on a new approach that is entirely automated, and based on automated extraction of the “quality” parameters from the available information on the project (its repository and mailing lists). The first result is a set of significant variables, that collectively give a set of quality indicators of the code and the community of developers around the project; these indicators will be included in the public database of projects, and will give a simple “semaphore”-like indication of what aspects may be critical and what are the project strengths.
On the other hand we have worked on the integration of the functional aspects in the evaluation process – that is, how to weight in features vs. the risk that the project may introduce. For this reason we have added to our guide a new, simplified evaluation schema, that includes both aspects in a single graph.
Creating a graph for a product selection involves three easy steps:
- starting from the list of features, extract those considered to be indispensable from the optional ones; all projects lacking in indispensable features are excluded from the list.
- for every optional feature a +1 score is added to the project “feature score”, obtaining a separate score for each project.
- using the automated tools from FLOSSMETRICS, a readiness score is computed using the following rule: for every “green” in the liveness and quality parameters a +1 score is added, -1 for every “red”.
This gives for each project a position in a two-dimensional graph, like this one:
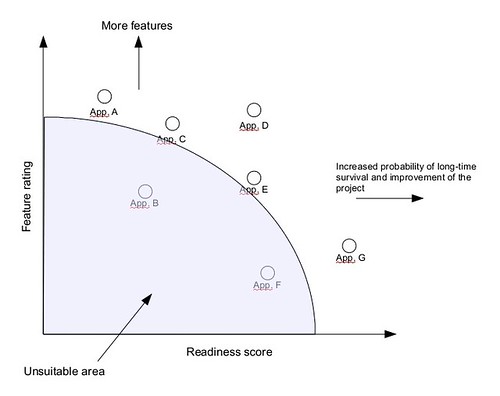
The evaluator can then prioritize the selection according to the kind of adoption that is planned: those that are mission-critical and that requires a high project stability (and a good probability that the project itself is successful and alive) will prefer the project positioned on the right-hand of the graph, while those that are more “experimental” will favour the project placed in the top:

This approach integrates the advantage of automated estimation of quality (and can be applied to the FLOSSMETRICS parameters or the previous QSOS ones) with a visual approach that provides in a single image the “risk” or inherent suitability of a set of projects. I hope that this may help in reducing that 20% of cost that is actually spent in deciding which package to use, thus improving the economic effectiveness or freeing more resources for other practical activities.