Archive for category OSS data
Comparing companies effectiveness: a response to Savio Rodrigues
Posted by cdaffara in OSS business models, OSS data, Uncategorized on March 9th, 2009
I was intrigued by a twit from Stéfane Fermigier, “Comparing only 1 oss vendor (RHAT) and 1 proprietary, monopolistic one (MSFT) is really a deep piece of economic science !” with a link to this article by long-time OSS debater/supporter/critic/fellow, Savio Rodrigues, that compares the financial breakdown of RedHat and Microsoft, and concludes that the commonly-held hypothesis that open source gives a capital advantage by providing savings on R&D is not true. In particular: “The argument is that commercial vendors spend on items such as advertising, marketing, R&D and most importantly, expensive direct sales representatives. We’re told that open source vendors spend significantly less on these items, and hence can be more capital efficient. These costs make up the difference between the costs of doing business as a commercial vendor vs. an open source vendor. Somehow, those numbers didn’t seem right to me.”
I am always skeptical of the “We’re told” part, as I also remember the “we’re told that all open source is developed by students in basements”, “we’re told that we can give the source code and people will start work on it” and many other, unsubstantiated or out-of-context comments.
I would like to point out a few things:
- first of all, there are structural limits in how public listed companies can perform, and how the financial breakdown is performed. If Savio tried to extend his (somewhat limited) analysis to other public companies in the same sector he would have found that most of them are nearly identical in R&D versus SG&A costs, when compared within the same class in terms of market capitalisation. In fact, only startups (that rarely can go to the stock market) have an higher-than-average R&D. Other companies with similar properties are companies in the biochemistry and drug design firms, that have a long incubation period to create a product, and for this reason have a high R&D share.
- Then, the balance sheet is in itself not a good way to measure the “productivity”, or savings in development compared to same-class companies. In fact, as I wrote some days ago, savings due to the adoption of OSS are not inherently visible in balance sheets, but appear as better quality product or as the capability of producing goods at a lower price point. In fact, just thinking of comparing RedHat with a company that is 55 times larger should provide an idea of how big an advantage is OSS in terms of efficiency.
- Many companies are helped by the existence of a “trialable” product, and in this sense there may be a core of truth in the idea that cost for customer acquisition may be lower. I am not convinced that cost reduction is so significant, at least not to the same extent of R&D advantages that are clearly easier to measure, and that tend to be significant.
I agree with Savio that competition should not happen exclusively on pricing (but it may be a part of a larger strategy), but I contend that by looking just at two balance sheet breackdowns can give us information on whether OSS is more or less efficient in terms of product creation. I continue to believe that in many markets OSS provides a substantial advantage: after all, Rishab et al. estimated the average R&D advantage at 36%; my estimates are from 20% to 75% in specific industrial areas, but in any case substantial.
update: Savio added another company (Tibco) which is similar to RedHat size; as before, it shows very similar results. It is my belief that even adding additional companies will more or less show that for software-intensive companies the results will be more or less the same. I also believe that the real comparison should happen outside the financial sheets, by comparing the market: in which markets do the company compete? What is the average size of the competitors? If we can show that on average OSS companies tend to be efficient competitors in markets much larger than their own, then we can show that OSS can give an advantage. If Rishab’s evaluation is right, the 36% increased efficiency should bring the equivalent of a capital advantage of 50% (roughly) so we should check whether RedHat or Alfresco effectively compete with companies that are at least 50% larger than themselves.
Rethinking OSS business model classifications by adding adopters’ value
Posted by cdaffara in OSS business models, OSS data on March 6th, 2009
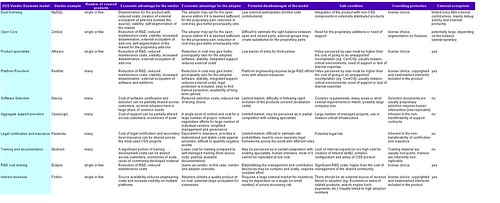
As a follow-up to our previous research in FLOSSMETRICS and OpenTTT, we are trying to improve our original classification, adapting it to the many changes that are happening in the commercial open source world. As a preliminary result, I would like to share with you the preliminary second version of our OSS model taxonomy, that includes a few relevant changes:
- It does, for the first time, disaggregate what was originally called ITSC (Installation, training, support, consulting) because many successful companies are now specializing in a single activity. This is a significant change from 2006 (when we started collecting data on OSS models), when companies were performing in a more or less undifferentiated way all those activities. We believe that this “specialization” will continue with the enlargement of the commercial OSS market.
- We removed the “badgeware” category from the list. We found that some of the vendors that originally followed this model disappeared, and for those remaining protection from freeriding and overall model was more or less morphed into a “open core” or “split oss/commercial”. As the visibility clause can now be included in the GPLv3, I believe that the remaining few badgeware licenses will disappear quickly.
- We have added an experimental section, related to the advantages for the vendor and for the adopters of OSS models. This section is in my opinion quite important in making this a sort of “cheatsheet” for companies that will be interested in using an OSS business model in the future, but is still subject to some revision. I would be grateful for any suggestion or correction to it.
Anyway, here is a link to the table in ODS format, and in html format:
From theory to practice: the personal desktop linux experiment
Posted by cdaffara in OSS business models, OSS data, blog on March 3rd, 2009
In my previous post, I tried to provide a simple theoretical introduction to the UTAUT technology adoption model, and the four main parameters that govern the probability of adoption; as a complement, I will present here a small demonstration on how to use the model to improve the adoption of a specific technology, that is the user-chosen personal computer with Linux as single operating system. The reason for the “user-chosen” is related to the different adoption processes for personal computers in a personal setting (for example hobbyist, student, micro-enterprise) versus the business or public authority environment- those will be discussed in a future post. The idea for this experiment came out of a workshop I held in Manila, where I had the pleasure to discuss with the technical manager of the largest PC chain in the Philippines about how to best introduce a Linux PC into the market.
To set the context: we will present an example of an optimization exercise for the take-up of a Linux-based PC, to be distributed and used mainly for personal purposes, and acquired through direct channels like large distribution networks, computer reseller chains, individual stores. The first important point is related to the market: there are really two separate transactions, the first one from the computer manufacturer to the chain and the second from the chain to the individual users. The two markets are distinct, and have widely differing properties:
- from manufacturer to chain: there is a small number of legal agreements (the reseller/redistribution agreements), the main driver for the manufacturer is to acquire volume, while the chain is interested in profit margins for the single sale and overall volume (how fast the stock can be moved), and sales of complimentary products
- from chain to users: there is a large number of very small transactions; the main driver for the chain is to get as much margin on aggregate sales as possible (think selling the PC, the printer and associated consumables) while the buyer is looking for a specific set of functionalities at a reasonable price, like being able to browse the web, using email, writing letters and such.
What is useful for the first transaction may be useless for the second; the fundamental idea is that both transactions have to happen and be sustainable for the market to be self-sustaining and long running (a short-running market may even be negative- if a chain start selling a model and discontinues it after a little while, the end users may believe that it is no longer sold because of defects or because it was not competitive. Think for a moment about the comments after WalMart stopped selling in store the very low cost Linux PC (that is still offered online); despite the fact that no real quality issues was found, most commentators associated the end of the experiment with a general failure for Linux PCs.(as for the source of the reference to quality issues, it is extracted from the Comes-vs-Microsoft documents related to WalMart: “We understand that there has not been a customer satisfaction issue. WalMart sets fairly strict standards for customer return rates and service calls”).
So, our optimization experiment need to satisfy two constraints: guarantee a margin (eventually compounded from accessory sales) on every sale, guarantee low inventory (fast turnaround), and this means that adopters should buy with a high probability after first or second sight. Let’s recall the four parameters for adoption, and apply them for the specific situation:
- performance expectancy: is this PC fast? is it able to perform the tasks that I need?
- effort expectancy: is it easy to use?
- social influence: is it appropriate for me to use? to be shown buying it? what my peers will say when I will show it?
- facilitating conditions: is there someone that will help me in using it? will it work with my network?
Let’s start with performance expectancy. Most “Linux pc” are really very low cost, substandard machines, assembled with the overall idea that price is the only sensitive point. In this sense, while true that Linux and open source allows for far greater customizability and speed it is usually impossible to compensate for extreme speed differences; this means that to be able to satisfy the majority of users, we cannot aim for “the lowest possible price”. A good estimate of the bill of materials is the median of the lowest quartile of the price span of current PC in the market (approximately, 10% to 20% more than the lowest price). After the hardware is selected, our suggestion is to use a standard linux distribution (like Ubuntu) and add to it any necessary component that will make it work out of the box. Why a standard distribution? Because this way users will have not only a potential community of peers to ask for help, but the cost of maintaining it will be spread – as an example, most tailor-made Linux distributions for NetBooks are not appealing because they employ old version of software packages. This provides an explanation of why Dell had so much success in selling Linux netbooks compared to other vendors, with one third of the netbooks sold with plain Ubuntu. Having a standard distribution reduces costs for the technology provider, provides a safety mechanism for the reseller chain (that is not dependent on a single company) and provides the economic advantage of a cost-less license, that increase the chain margin.
Effort expectancy: what is the real expectancy of the user? Where do the user obtains his informations from? The reality is that most potential adopters get their information from peers, magazines and in many cases from in-store exploration and talks with store clerks. The clear preference that most users demonstrate towards Windows really comes from a rational reasoning based on incomplete information: the user wants to use the PC to perform some activites, he knows that to perform such activities software is needed, he knows that Windows has lots of software, so Windows is a safe bet. The appearance of Apple OS X demonstrated that this reasoning can be modified, for example by presenting a nicer user experience; OS X owners get in contact with other potential adopters, are shown a different environment that seems to be capable of performing the most important talks, and so the diffusion process can happen. For the same process to be possible with Linux, we must improve the knowledge of users, to show them that normal use is no more intimidating than that of Windows, and that software is available for the most common tasks.
This requires two separate processes: one to show that the “basic” desktop is capable of performing traditional tasks easily, and another to show what kind of software is available. My favourite way for doing this for in-store experiences is through a demo video, usually played in continuous rotation, that shows some basic activities: for example, how Network Manager provides a simple, one-click way to connect to WiFi, or how Nautilus provides previews of common file formats. There should be a fast, 5-minute section to show that basic activities can be performed easily. I prefer the following list:
- web browsing (showing compatibility with sites like FaceBook, Hi5, Google Mail)
- changing desktop properties like backgrounds or colours
- connecting to WiFi networks
- printer recognition and setup
- package installation
I know that Ubuntu (or OpenSUSE, or Fedora) users will complain that those are functionalities that are nowadays taken for granted. But consider what even technical journalist sometimes may write about Linux: “It booted like a real OS, with the familiar GUI of Windows XP and its predecessors and of the Mac OS: icons for disks and folders, a standard menu structure, and built-in support for common hardware such as networks, printers, and DVD burners.”
Booted like a real OS. And - icons!
So much for the change in perspective, like the Vista user perception problem demonstrated. So, a pictorial presentation is a good media to provide an initial, fear-reducing informative presentation that will not require assistance from the shop staff. On the same side, a small informative session may be prepared (we suggested a 8-page booklet) for the assistants to provide answers comparable to that offered for Windows machines. Usability of modern linux distribution is actually good enough to be comparable to that of Windows XP on most tasks. In a thesis published in 2005, the following graph was presented, using data from previous work by Relevantive:
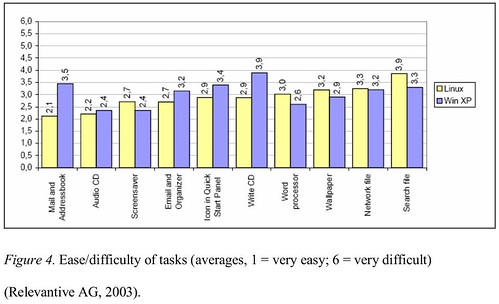
The time and difficulty of tasks was basically the same; most of the problems that were encountered by users were related to bad naming of the applications: “The main usability problems with the Linux desktop system were clarity of the icons and the naming of the applications. Applications did not include anything concerning their function in their name. This made it really hard for users to find the right application they were looking for.” This approach was substantially improved in recent desktop releases, adding a suffix to most applications (for example, “GIMP image editor” instead of “GIMP”). As an additional result, the following were the subjective questionnaire results:
- 87% of the Linux test participants enjoyed working with the test system (XP: 90%)
- 78% of the Linux test participants believed they would be able to deal with the new system quickly (XP: 80%).
- 80% of the Linux test participants said that they would need a maximum of one week to achieve the same competency as on their current system (XP: 85%).
- 92% of the Linux test participants rated the use of the computers as easy (XP: 95%).
This provides evidence than, when properly presented, a Linux desktop can provide a good end-user experience.
The other important part is related to applications: two to five screenshots for every major application will provide an initial perception that the machine is equally capable of performing the most common tasks; and equally important is the fact that such applications need to be pre-installed and ready to use. And with ready to use, I mean with all the potential enhancements that are available but not installed, like the extended GIMP plugin collection that is available under Ubuntu as gimp-plugin-registry, or the various thesauri and cliparts for OpenOffice.org. A similar activity may be performed with regards to games, that should be already installed and available for the end user. Some installers for the most requested games may be added using wine (through a pre-loader and installer like PlayOnLinux); we found that in recent Wine builds performance is quite good, and in general better than that of proprietary repackaging like Cedega.
One suggestion that we added is to have a separate set of repository from which to update the various packages, to allow for pre-testing of package upgrades before they reach the end users. This, for example, would allow for the creation of alternate packages (outside of the Ubuntu main repositories) that guarantee the functionality of the various hardware part even if the upstream driver changes (like it recently happened with the inclusion of the new Atheros driver line in the kernel, that complicated the upgrade process for netbooks with this kind of hardware chipset). The cost and complexity of this activity is actually fairly low, requiring mainly bandwidth and storage (something that in the time of Amazon and cloud computing has a much lower impact) and limited human intervention.
The next variable is social acceptance, and is much more nuanced and difficult to assess; it also changes in a significant way from country to country, so it is more difficult for me to provide simple indications. One aspect that we found quite effective is the addition, on the side of the machine, of a simple hologram (similar to that offered by proprietary software vendor) to indicate a legitimate origin of the software. We found that a significant percentage of potential users looked actually in the back or the side of the machine to see if such a feature was present, fearing that the machine could possibly be loaded with pirated software. Another important aspect is related to the message that is correlated to the acquisition: one common error is to mark the machine as “the lowest cost”, a fact that provides two negative messages: the fact that the machine is somehow for “poors”, and the fact that value (a complex, multidimensional variable) is collapsed only on price, making it difficult to provide the message that the machine is really more about “value for money” than “money”. This is similar to how Toyota invaded the US car market, by focusing both on low cost and quality, and making sure that value was perceived in every moment of the transaction, from when the potential customer entered the show room to when the car was bought. In fact, it would be better to have a combined pricing that is slightly higher than the lowest possible price, to make sure that there is a psychological “anchoring”.
While price sensitive users are, along with “enthusiasts”, those that up to now drove the adoption of Linux on the desktop, it is necessary to extend this market to the more general population; this means that purely “price-based” approaches are not effective anymore.
As for the last aspect, facilitating conditions, the main hurdle perceived is the lack of immediate assistance by peers (something that is nearly guaranteed with Windows, thanks to the large installed base). So, a feature that we suggested is the addition of an “instant chat” icon on the desktop to ask for help, and brings back a set of web pages with some of the most commonly asked questions and links to online fora. The real need for such a feature is somehow reduced by the fact that the hardware is preintegrated and that pre-testing is performed before package update, but is a powerful psychological reassurance, and should receive a central point in the desktop. Equally important the inclusion of non-electronic documentation, that allows for easy “browsing” before the beginning of a computing session. A very good example is the linux starter pack, an introductory magazine-like guide that can be considered as an example.
We discovered that plain, well built Linux desktops are generally well accepted, with limited difficulties; most users after 4weeks are proficient and generally happy of their new user environment.
The dynamics of OSS adoptions, II – diffusion processes
Posted by cdaffara in OSS business models, OSS data, Uncategorized on February 27th, 2009
(followup post of “the dynamics of OSS adoption – 1“)
The most common process behind OSS adoption is called “diffusion”, and is usually modelled using a set of differential equations. It is based on the idea that the market is made of a set of interoperating agents, each one deciding independently which technology to adopt in different moments; the model is usually capable of handling multiple participants in a market, and to predict overall evolution. A good example of a diffusion-based dynamic equilibrium is the web server market, when total server numbers are used. If we take the data from Netcraft, and we model each individual server type as a competitor, we got this kind of graph:
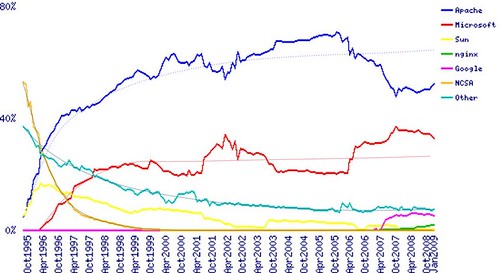
Which is consistent with a traditional Bass Model explanation (data for apache was added to that of Google Web server, that is Apache-based; bicubic smoothing was used to get the trend lines). Diffusion models tend to generate this kind of equilibrium lines, with the market that in a more or less consistent way moves to an equilibrium that changes only when a specific technology is substituted by moving to another, different status.
The probability of choosing one technology over the other depends on several factors; a very good model for such adoption is the UTAUT model (some pdf examples here and here), that was found capable of predicting 70% of the variance of adoption success (what it means: that the parameters in the model explain nearly perfectly whether you will adopt a technology or not).
The important point to remember: this is about *individual* adoption, not mandated and without external constraints. In this sense, we can use it to predict how a PC owner chooses her web browser, or how a small company may choose which web server to use.
The model uses four parameters: performance expectancy, effort expectancy, social influence, and facilitating conditions.
- performance expectancy: The degree to which a person believes that using a particular system would enhance his or her job performance, or the degree to which using an innovation is perceived as being better than using its precursor.
- effort expectancy: the degree to which a person believes that using a system would be free of effort, or the degree to which a system is perceived as relatively difficult to understand and use.
- social influence: The individual’s internalization of the reference group‘s subjective culture, and specific interpersonal agreements that the individual has made with others, in specific social situations; or the degree to which use of an innovation is perceived to enhance one‘s image or status in one‘s social system.
- facilitating conditions: Reflects perceptions of internal and external constraints on behaviour and encompasses self-efficacy, resource facilitating conditions, and technology facilitating conditions; or objective factors in the environment that observers agree make an act easy to do, including the provision of computer support.
In the next post, I will present an example of these four parameters in the context of an OSS adoption.
Random walks and Microsoft
Posted by cdaffara in OSS business models, OSS data, blog, divertissements on February 26th, 2009
Sometimes talking about Microsoft and Open Source software is difficult, because it seems to have many heads, looking into different directions. At the Stanford Accel Symposium, Bob Muglia, president of Microsoft’s Server and Tools Business was bold enough to say that at some point, “At some point, almost all our product(s) will have open source in (them)…If MySQL (or) Linux do a better job for you, of course you should use those products“. Of course, we all know that; even Steve Ballmer mentioned that “I agree that no single company can create all the hardware and software. Openness is central because it’s the foundation of choice“; a fact for which Matt Asay commented with some irony that openness claims are mainly directed towards competitors like Apple and its iTunes/iPod offer.
I would like just to point out to one of the Comes vs. Microsoft exhibits (that are sometimes more interesting than your average John Grisham or Stephen King novels) where we can find such pearls of openness and freedom of choice:
From: Peter Wise
Sent: Monday, October 07, 2002 9:43 AM
To: Server Platform Leadership Team
Subject: CompHot Escalation Team Summary - Month of September 2002
CompHot Escalation Team Summary - Month of September 2002

Microsoft Confidential

Observations and Issues

* Linux infestations are being uncovered in many of our large accounts as
  part of the escalation engagements. People on the escalation team have
  gone into AXA, Ford, WalMart, the US Army, and other large enterprises,
  where they've helped block one Linux threat, only to have it pop up in
  other parts of the businesses. At General Electric alone, at least five
  major pilots have been identified, as well as a new "Center of Excellence
  for Linux" at GE Capitol.
“Infestation” is not exactly the word I would use to express the idea of “customer choice”, but you know how the software world is a battle zone. I am so relieved to see that they are now really perceiving open source as part of their ecosystem.
Transparency and dependability for external partners
Posted by cdaffara in OSS business models, OSS data, blog on February 25th, 2009
As a consultant, it happens frequently to answer questions about “what makes open source better”. Not only for some adopter, but for companies and integrators that form a large network ecosystem, that (up to now) had only proprietary software vendors as source of software and technology. Many IT projects had to “integrate” and create workarounds for bugs in proprietary components, because no feedback on status was available. Mary Jo Foley writes on the lack of feedback to beta testers from Microsoft:
“During a peak week in January we (the Windows dev team) were receiving one Send Feedback report every 15 seconds for an entire week, and to date we’ve received well over 500,000 of these reports.”
Microsoft has “fixes in the pipeline for nearly 2,000 bugs in Windows code (not in third party drivers or applications) that caused crashes or hangs.”
That’s great. Microsoft is getting a lot of feedback about Windows 7. What kind of feedback are testers getting from the team in return? Very little. I get lots of e-mail from testers asking me whether Microsoft has fixed specific bugs that have been reported on various comment boards and Web sites. I have no idea, and neither do they. (emphasis mine)
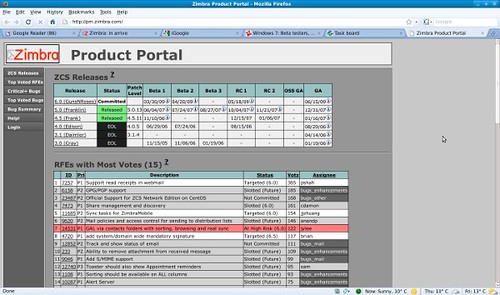
Open source, if well managed, is radically different; I had a conversation with a customer just a few minutes ago, asking for specifics on a bug encountered in Zimbra, answered simply by forwarding the link to the Zimbra dashboard:
Not to be outdone, Alfresco has a similar openness:
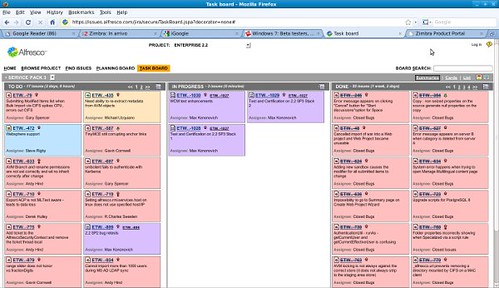
Or one of my favourite examples, OpenBravo. Transparency pays becuase it provides a direct handle on development, and provides a feedback channel for the (eventual) network of partners or consultancies that “are living” off an open source product. This kind of transparency is becoming more and more important in our IT landscape, because time constraints and visibility of development are becoming even more important than pure monetary considerations- and allows for adopters to eventually plan for alternative solutions depending on the individual risks and effort estimates.
On business models and their relevance
Posted by cdaffara in OSS business models, OSS data on February 24th, 2009
Matthew Aslett has a fantastic summary post that provides a sort of synthesis of some of the previous debates on what is an OSS business model, and how this model impacts the performance of a company; along with the usual sensible comments. There are a few points that I would like to make:
- It is probably true that a pure service-based company is less interesting for VC looking for an equity investment (by service-based I mean: “Product specialists: companies that created, or maintain a specific software project, and use a pure FLOSS license to distribute it. The main revenues are provided from services like training and consulting” from the FLOSSMETRICS guide). Every service-based model of this kind is limited by the high percentage of non-repeatable work that should be done by humans; so the profit margins are lower than those of the average software industry or of other OSS models. On the other hand, unconstrained distribution (facilitated by the clear, unambiguous model and single license) in many cases compensates for this lower margin by increasing the effectiveness of marketing messages.
- Tarus Balog notes: “For those companies trying to make billions of dollars on software quickly… the only way to do that in today’s market is with the hybrid model where much of the revenue comes from closed software licenses.” That’s right- at the moment this seems the only possible road to a 1B$ company. What I am not convinced of is that this is in itself such a significant goal; after all, the importance of being “big” is related to the fact that bigger companies have the capability of creating more complex solutions, or to be capable of servicing customers across the globe. But in OSS, complex solutions can be created by engineering several separate components, reducing the need of a larger entity creating things from scratch; and cooperation between companies in different geographical areas may provide a reasonable offering with a much smaller overhead (the bigger the company, the less is spent in real R&D and support). A smaller (but not small) company may still be able to provide excellent quality and stability, with a more efficient process that translates into more value-for-dollar for the customer.
- I believe that in the long term the market equilibrium will be based on a set of service-based companies (providing high specialization) and development consortia (providing core economies of scale). After all, there is a strong economic incentive to move development outside of companies and in reduce coding effort through reuse. Here is an example from the Nokia Maemo platform:
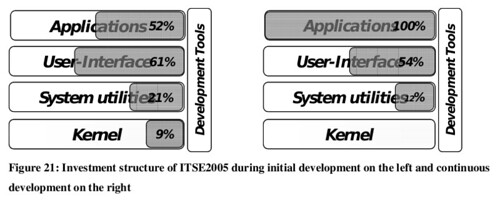 In this slide from Erkko Anttila’s thesis (more data in this previous post) it is possible to see how development effort (and cost) was shifted from the beginning of the project to the end. The real value comes from being able to concentrate on differentiating, user-centered applications – those can be still developed in a closed way, if the company believes that this gives them greater value; but the infrastructure and the 80% of non-differentiating software expenditure can be delivered at a much lower price point if developed in a shared way.
 - Development consortia (like the Eclipse consortium) can act as a liasion/clearing office for external contributions, simplifying the process of contribution from companies. The combination of visibility and clear contribution processes can help companies in the shift from “shy participants” that prefer to have individual developers commit changes to projects (thus relieving the company from any liability, but still reaping the advantages of participation) to contribution and championing.
The dynamics of OSS adoption – 1
Posted by cdaffara in OSS business models, OSS data on February 24th, 2009
There are many different mechanisms behind OSS adoption, and understanding the differences makes it easier to help companies in using them efficiently – after all, word of mouth may be sufficient to get visibility, but it may be not enough to guarantee adoption, and then converting this adoption into paid services.
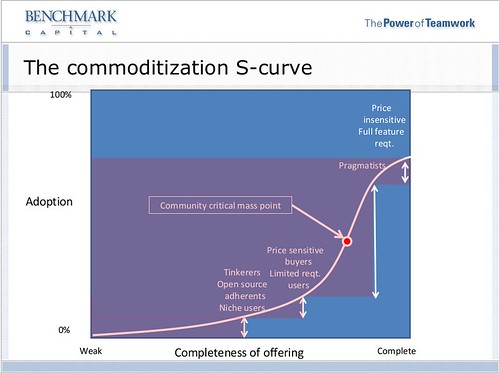
In fact, monetization may require a large number of “adopters” to get a small percentage of “paid users” – in many domains, only 0.05% of adopters pays for services, a percentage that we call “unconstrained monetization percentage” or UMP to make it sound more academic.
While it is true that the incremental cost for the OSS company of having a new adopter is zero (or extremely small), the increased adopters base also increments the probability that the community or some competitor will start to address the same monetization path, thus further reducing the UMP. So, to take the example of MySQL, instead of asking services or training to Sun, an adopter may opt for a local consulting firm that effectively leverage the free availability of the code and ancillary material to create a competitive entry.
Of course, the business model adopted by the OSS firm also has a positive or negative effect on the growth process in the number of adopters; this especially affects firms offering what we called “split OSS/commercial” or “open core” licensing that are forced to constantly adapt the features of the OSS and commercial parts; as we wrote:
“The model has the intrinsic downside that the FLOSS product must be valuable to be attractive for the users, but must also be not complete enough to prevent competition with the commercial one. This balance is difficult to achieve and maintain over time; also, if the software is of large interest, developers may try to complete the missing functionality in a purely open source way, thus reducing the attractiveness of the commercial version. ”
In other words, if the OSS product is too good, few will be interested in getting the commercial part, while if the OSS product is useless, the number of “adopters” will be too low to increase visibility of the product. This balance changes with time, and for this reason companies adopting this model need to constantly update their offering, and evaluate with time how to split the development effort across paid and OSS branches.
As I wrote in the beginning, there are many different adoption processes in open source software; some of those mechanisms are:
- diffusion/dissemination
- cluster propagation
- directed incentives
- enforcement
In the following posts I will try to provide some insight into each, and how to help an OSS company in leveraging the relevant process to help in both adoption and monetization.
Why use OSS in product development
Posted by cdaffara in OSS business models, OSS data on February 20th, 2009
Many analysist talk about the potential savings of using OSS. One of the more visible place to see this savings is in “integrated reuse”, the leverage of OSS components to reduce development and maintenance costs. I will take some examples from an excellent thesis Erkko Anttila, “Open Source Software and Impact on Competitiveness: Case Study” from Helsinki University of Technology. Erkko interviewed many actors from Nokia and Apple about their adoption of OSS in the Maemo platform and in OSX, and measured the OSS contribution through the traditional (albeit not always accurate) COCOMO model. Here are some results:
Maemo:
The total software stack includes 10.5 million lines of code (product and development tools), which is split into 85% coming directly from OSS, and 15% either modified or developed by Nokia. In source code lines the respective amounts are 8.9 Million lines of OSS code and 1.6 million lines of Nokia developed software. Out of the 15% created by Nokia, 50% are made available to the community as modifications to components or totally new components, leaving roughly 7.5% of the software stack closed. (…) Based on the COCOMO model we can estimate the value of the utilized OSS to be $228,000,000, including both product software and tools.”
Apple:
“Based on the COCOMO model the total cost of internally developing the OSS included in the Darwin core and the used development tools would be $350,000,000.”
This is not, however, the only advantage; as Ari Jaaksi of Nokia mentioned during one of his presentations: “No need to execute complex licensing negotiations; Saving can be up to 6- 12 months in real projects”. 6-12 months of totally non-productive wait are not a bad savings, but when added to the developers time saved by reuse we have estimated that for end-user products the total savings are between 12 and 18 months; and for consumer products (especially in IT) reducing time to market by one year means having a significant first-mover advantage. So, the next time someone wonders why LCD TVs from Sony, Sharp, LG use Linux and other OSS components inside, tell them that it’s the only way to be competitive…
Hello world!
Posted by cdaffara in OSS business models, OSS data, blog on February 17th, 2009
Welcome to our public blog, where we will try to provide a window on the research activities that we do in the field of open source business models and OSS economics. Most of our work is oriented towards helping our customers in the evaluation and adoption of OSS (and sometimes helping companies in offering OSS-based services), so the focus will be clearly oriented towards commercialization and business aspects, and less
on technical aspects; I hope that you will enjoy our effort and I invite any people interested in this research area to transform this blog into a conversation and discussion on what is still a wide open research space.