Archive for category OSS business models
I respectfully disagree.
Posted by cdaffara in OSS business models, OSS data, blog on March 25th, 2009
Microsoft has recently published a white paper on Microsoft and OSS, called “Participation in a world of choice”. It’s a nice 16-pages pdf, with kind words on the role of OSS in the modern IT landscape, the fact that “It is important to acknowledge that the relationship between open source and Microsoft has at times been characterized by strong emotions and harsh words” (some of which were from Microsofties themselves, like the infamous “cancer”), and that the future will be nice and warm and fuzzy. Despite the fact that – for probably the first time – a white paper contains a significant bibliography that includes academic papers, I have to say that I am not impressed by the content, that basically tries to reposition free software and open source in a context that is not entirely appropriate, and selectively presents a view of the market that is not in my opinion accurate.
(A note of warning: this post is not written out of “hate” of Microsoft. I am old enough to remember when IBM was the death empire (and its legal team was called “the nazguls” because they were unstoppable, fearless and devoid of human emotions), when Sun claimed that linux was a “bathub of code, … and sometimes what floats in it is not pleasant”, and at the same time I recognize the great advances that both companies made in recent years in open source. It would be my greatest pleasure to see Microsoft participate in OSS fully in the same way, but as it was for the companies I mentioned before, they have to prove themselves- and be slightly less schizophrenic in their message on OSS. End of note.)
So, I would like to point out a few things that I found in the paper:
- page 1: “… and increasing opportunities for developers to learn and create by combining community-oriented open source with traditional commercial approaches to software development.” First of all, not all open source is community oriented; here, Microsoft implies that all open source is developed in a community-oriented way (something that is not true, for example for dual-licensed software that has a much lower external participation rate, or for vendor-dominated consortia). Then, the use of “commercial” is wrong: free software and open source can be as commercial as software from the proprietary world. I would say that the copywriter here tried to suggest that OSS is “noncommercial” (something that our study , while the reality is that FLOSS in “nonproprietary”.
- Then we have the table in page 4:
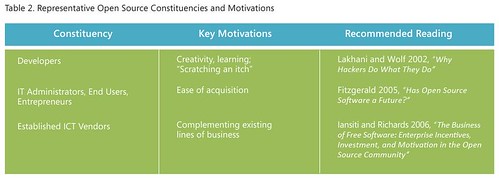
What the present is a very limited view both of the constituencies, and the motivations for using OSS.There are many studies that present the reason for developers to participate in OSS; among them, ethical reasons, practical reasons (what is called here “scratching an itch”), self improvement, “signaling” (demonstrating capabilities in development to increase employment opportunities), and roughly 50% of the developers are paid to work on OSS. Assuming that transient reasons are the real motivations of OSS development provides a negative view (because as those personal interests may be short-lived, the software itself may be short-lived too).
- In the same table: the author places “IT Administrators, End Users, Entrepreneurs” in a single cathegory. Ok- this is not a research article, but even a novice would probably find differences among them. If the tags identify endogenous use, then having as a single advantage “ease of acquisition” is clearly a way to downplay the additional advantages of OSS. Among them, the reduced lock-in (that casually is never mentioned in the document), or reduced costs (as mentioned previously in my work on “OSS myths“, for example in the surveys by CIOinsight, or our work in the COSPA project). If the mention is for companies that use OSS inside their software (both for internal use or for commercialization) there are other demonstrations that OSS has substantial economic advantages. And where are the OSS companies? Those cannot be included in the last line, about “established ICT vendors”… They even mention themselves an example that does not fit in the table: “Apple shifted to what has been called an “embrace and layer” strategy for its consumer operating system by leveraging permissively licensed open source BSD code for functionality such as networking infrastructure, while focusing its commercial R&D on building a proprietary graphical user interface (GUI) “on top,” and licensing the resulting product as a whole under a traditional commercial license.” (In my classification, that would fit within the “R&D cost sharing”)
- Page 5: ” Another industry analyst firm, the 451 Group, identified more than 100 ICT companies who rely on OSS to generate a significant portion of their revenue. At the same time, it found “the majority of open source vendors utilize some form of commercial licensing to distribute, or generate revenue from open source software”. Of course! The error is the same already mentioned, that is the confusion between “proprietary” and “commercial”.
- Page 7: “OSS approaches tend to be relatively more successful when the end users of a technology are themselves developers, as opposed to nontechnical end users”. The phrase is incorrect, and arise from the identification of OSS developers as volunteers that “scratch an itch”. From a logical point of view, there are two errors: first of all, there are many technical users that are not developers (system administrators are a good example). In fact, the very high penetration of OSS in server environments is not strictly related to developer participation. Second, the assumption that OSS is inherently difficult to use (implied in the phrase) is easily dispelled by the great success of FireFox and OpenOffice (both of which require no “developer” in sight).
- Page 7: “Windows Server product strategy continues to focus on offering a product that IT administrators will choose over alternatives (including Linux), because it is highly manageable with readily available skills, supported by a wide range of third-party applications, and offers the lowest total cost of ownership (TCO).” This is marketing, not research- first of all, the TCO debate is still not solved in favor of Microsoft (and after reviewing the TCO numbers for COSPA, I suspect that that would not be an easy win for them). Then, it implies that OSS skills are not readily available (again, something that is unproven) and it implies that OSS alternatives have a limited range of third-party applications (look at RedHat certified applications list for a good counterexample).
- Page 8: “For developers, the entire .NET Framework is available as a reference source to enable them to debug against the source code”. And since it is not open source, this should probably not be mentioned here.
- Page 9: “One key, supporting principle is respect for the diverse—and continually evolving—ways that individuals and companies choose to build and market what they create. No efficient, effective technical solution should be precluded or advantaged because an individual, a vendor, or a development community has chosen a particular business model—whether based on software licensing, service and support, advertising, or, increasingly, some combination thereof.” This is aimed squarely at those governments that are trying to estabilish pro-OSS policies, and ignores the fact that in many cases the inherent market situation (with a de-facto monopoly) is not a balanced market in itself. Recently it was found that “Software tenders by European public administration often may not comply with EU regulations, illegally favouring proprietary applications”; so the advantage is at the moment squarely for proprietary software vendor, and the recent guidelines from the EU are designed to provide a more balanced market. My own suggestion is to evaluate the whole cost of an IT adoption using metrics that cover the full lifetime of an application; my favourite is the German WiBe model.
- Page 9: “A second key principle is a balance that preserves constructive competition and healthy incentives: when individuals and companies are rewarded for creative differentiation, customers benefit from a dynamic marketplace that offers more product choices. Incentives for commercial investment in new innovation should coexist and coevolve alongside practical mechanisms for sharing intellectual property (IP)—with the overarching focus on a dynamic industry that continues to bring great ideas to customers.” And this is for those that are asking for the abolition or the reduction in scope of software patents, and the invocation of open standards that are non-IPR encumbered. I already wrote in the past against software patents, and I believe to be not alone in claiming that the hypothetical advantage of software patents seems to pale in comparison to the extensive damage that it is causing to the industry. (And no- claiming that the thriving software ecosystem that we see now happens because of software patents should be rephrased in “the thriving software ecosystem that we see now happens despite of software patents”)
- Page 10: “We have long sought to contribute to the growth of an open ecosystem, whether through publicly documenting thousands of application programming interfaces (APIs)”. It took the European Commission, and a record fine for violation of EU monopoly laws, to abtain the release of crucial APIs…
- Page 10: “More than 500 commercial IP agreements with companies from a wide range of industries- including companies building their businesses around OSS”. Again: I would not claim that, after the substantial brouhaha in the Novell patent pact (considering that it does not covers things like OpenOffice…)
- Page 10: ” And we have stated broad openness to noncommercial OSS development through the Patent Pledge for Open Source Developers.” Nice- despite the fact that “noncommercial OSS” is an oxymoron, as placing additional redistribution limits make it non-OSS.
The paper ends with a very promising phrase: “We recognize that in the future, Microsoft ’s relationship with OSS may be punctuated by strong emotions and the possibility of interests that at times will be in conflict. But we are profoundly optimistic … will surface new opportunities for Microsoft and open source to “grow together” in purposeful and complementary ways.
I would be very happy to have Microsoft as a good OSS citizen, even with the recognition that their path may sometimes conflict (this is true also of other “fellows” like IBM or Sun, as well). But I would start with a more balanced introduction, or at least one that has not such a significant percentage of “hidden” ideas. Openness is before everything else in the mind; if your ideas are strong enough they will survive and thrive.
Another data point on OSS efficiency
Posted by cdaffara in OSS business models, OSS data on March 18th, 2009
I already wrote something in response to Savio Rodrigues post on the lack of differentiation in R&D expenditure between RedHat (“OSS”) and Microsoft and Tibco (“proprietary”). Savio found in the similar spending in R&D an indication that OSS companies are not implicitly more efficient, while I believe that the differences appear outside balance sheets, both in stronger offering and in competition efficiency, both not apparent in R&D spending.
A recent research from Venice University’s TEDIS seems to match at least part of my hipotesis:
“Infine, confrontando i singoli dati relativi alle sole imprese con fatturato inferiore ai 500.000 euro con la variabile relativa alle classi dimensionali delle aziende clienti (per numero di dipendenti), si può ipotizzare una correlazione tra l’utilizzo di software Open Source e la capacità di attrarre clienti di dimensioni relativamente più grandi. A parità di fatturato, insomma, le aziende “solo Open Source”, sembrano avere maggiori chances di ottenere commesse da aziende con oltre 50 dipendenti (quindi medio-grandi rispetto al nostro universo di riferimento).“
(my english translation: “Finally, comparing the individual data on firms with turnover of less than 500,000 euros with the variable on size classes of customers (by number of employees), one can hipotesize a correlation between the use of software Open Source and the ability to attract customers of relatively larger scale. At the same turnover, in other words, companies “Open Source only” seem to have more chances to obtain work orders from companies with more than 50 employees (ie medium – large compared to our universe of reference).”
This, given the relative similarity of other data (like revenue-per-employee of the cluster) provide at least an hint that OSS gives “leverage” in the kind of activities that a small company can create or propose to the market. As I wrote in my previous post: “In the smallest example (100000 lines of code, still substantial) the average staffing is reduced from more than 20 developers to slightly less than 9, bringing this project within reach even by small companies, and in my personal view it explains the exceptional take-up of OSS by new and innovative companies, that even before external sources of capital (like VCs) are capable of creating non-trivial projects with very limited resources.”
Estimating savings from OSS code reuse, or: where does the money comes from?
Posted by cdaffara in OSS business models, OSS data, Uncategorized on March 17th, 2009
We are approaching 100% of usage within other software, that is every software system contains some OSS code inside. Why? There is a perfectly sound reason, and this reason is related to a long standing tenet of software engineering: doing software takes time and money, and code needs to be maintained for a long time- adding additional costs on top. In one of the most widely known article in software engineering (“no silver bullet: essence and accidents of software engineering“), Frederick Brooks exposes some fundamental reasons behind the inherent difficulty of making software, especially large scale software systems. He also coined his law, the “no silver bullet law”:
There is no single development, in either technology or in management technique, that by itself promises even one order of magnitude improvement in productivity, in reliability, in simplicity.
Despite many trials, and many technologies (better languages, OOP, formal methods, automatic programming and many others..) the law has remained true until now. In the same article, however, Brooks marks some potential attacks on the inherent difficulty of making software:
- buy, don’t build (that is, if possible don’t code at all)
- requirement refining, rapid prototyping, incremental building
- great designers
It is quite easy to make a parallel with open source style development, that promotes the same ideas:
- reuse components and source code from other projects
- release early/release often (or allow anyone read access to CVS for making their own version)
- meritocracy (small group of respected core developers, and many smaller contributors)
In the software engineering world the reuse of code coming from the “external” world is commonly called COTS, Commercial Off The Shelf, and has been studied for many years. Boehm and others created a model for mixed development that can be graphically presented as:
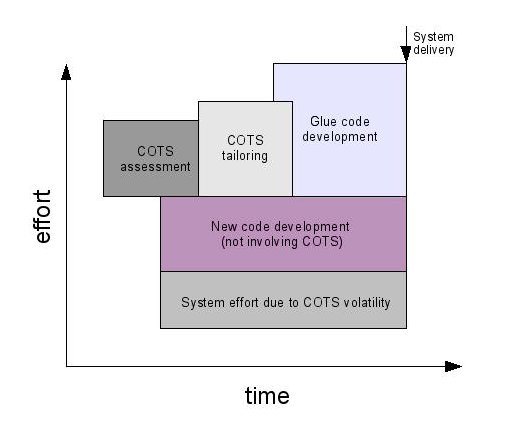
As can be seen in the image, there are costs that are related to the integration of COTS (in our case, OSS) within a newly developed product. These costs are related to the evaluation (and searching) of OSS, “tailoring” (the adaptation of the code for the project needs), and development of glue code (the layer of code between OSS modules and between OSS and internally developed code).
I would like to present some results based on the COCOMO II model, adapted to a model where a varying percentage of code is developed or reused from OSS. First of all, some assumptions:
- The average company cost of a developer is fixed at 25€ per hour. It should be a reasonable approximation of european costs (in particular, costs in mediterranean areas like Spain, France, Italy, Greece); we know that it is considerably lower than other estimates (especially US ones), but this way we provide a “lower bound” for savings instead of averages.
- The “tailoring” of code is performed on 15% of the OSS code; percentage comes from several separate projects, with estimates ranging from 5% for mature projects with structured and well-documented interfaces to 20% for complex, deeply-interlocked code like that found in embedded systems.
- Tailoring cost is higher than traditional coding; for this reason, the COCOMO complexity index is increased to 6 compared to new-code development.
- Volatility is based on our own model for cost estimation and data from literature on COTS (“Empirical observations on COTS software integration effort based on the initial COCOTS calibration database”, Abts C., Boehm B.W., Bailey Clark E.) and it can be approximate with an average effort equivalent to 1.5 to 2.5 full time person-year.
This is the result:
| Project size (lines of code) | % of OSS | total cost (Keuro) | Savings | duration (years) | avg. staffing |
| 100000 | 0 | 1703 | 0% | 1.7 | 20.5 |
| 100000 | 50 | 975 | 43% | 1.3 | 15.4 |
| 100000 | 75 | 487 | 71% | 0.9 | 8.6 |
| 1000000 | 0 | 22000 | 0% | 3.3 | 141.7 |
| 1000000 | 50 | 12061 | 45% | 2.6 | 103.2 |
| 1000000 | 75 | 3012 | 86% | 2 | 32 |
| 10000000 | 0 | 295955 | 0% | 7.5 | 818 |
| 10000000 | 50 | 160596 | 46% | 5.9 | 631.2 |
| 10000000 | 75 | 80845 | 73% | 3.8 | 421 |
In the case of 10Mlines of code, the saving is estimated at more than 210M€, that is consistent with previous estimates of savings by Nokia in reusing open source within Maemo. Even for the “small” project of 100000 lines, the savings are estimated at 1.2M€. Another interesting aspect is related to staffing and time: not only the use of OSS can reduce development time substantially, but it allows for a substantial reduction in the amount of staff necessary for the development. In the smallest example (100000 lines of code, still substantial) the average staffing is reduced from more than 20 developers to slightly less than 9, bringing this project within reach even by small companies, and in my personal view it explains the exceptional take-up of OSS by new and innovative companies, that even before external sources of capital (like VCs) are capable of creating non-trivial projects with very limited resources.
OSS-based business models: a revised study based on 218 companies
Posted by cdaffara in OSS business models, OSS data on March 16th, 2009
After the publication of our revised OSS business model taxonomy, we have finally finished the second survey from FLOSSMETRICS, that now covers 218 companies (again, excluding companies that have less than 30% of revenues coming from OSS, and excluding companies that sell a proprietary product based on OSS, as there are simply too many of them). Some companies are using more than one model (for example, many dual-licensing companies also sell services and support, and thus can be classified also as product specialists).
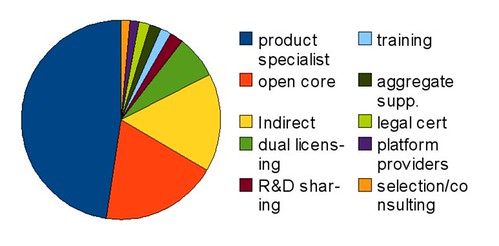
With the actual numbers:
| Model name | # companies |
| product specialist | 131 |
| open core | 52 |
| Indirect | 44 |
| dual licensing | 19 |
| R&D sharing | 6 |
| training | 5 |
| aggregate supp. | 5 |
| legal cert | 5 |
| platform providers | 4 |
| selection/consulting | 4 |
Some important considerations: product specialists are counted only when there is a demonstrable participation of the company into the project as “main committer”; otherwise, the number of specialists would be much greater, as some projects are the center of commercial support from many companies (a good example is OpenBravo or Zope). The distribution of revenue (approximate, as most companies are not publishing revenue data) seems to match that of average IT sector, with the vast majority of companies of small size (less than 5M$), around 10% are medium sized (5 to 20M$) and very few can be classified as “large”. Another observation is the fact that platform providers, while limited in number, tend to have a much larger revenue rate than both specialists or open core companies.
Overall there seems to be no significant difference in revenuse (comparing same-class companies) between product specialists compared to open core companies, but this is based on uncertain estimates of relative revenues, and should be taken as purely speculative. What seems to be constant is the reported increase in visibility and sales leads experienced by companies that adopted a pure open source model (be it dual licensing, specialists or based on indirect revenues); as before, it is possible to check this kind of increase only through web-based metrics (that are in many cases unreliable) and by indirect measurements like user participation in forums or dedicated conferences.
Another take on the financial value of open source
Posted by cdaffara in OSS business models, OSS data on March 13th, 2009
The “real” value of open source in financial terms has been one of my favourite arguments, and I had the opportunity to research in this area for a long time, thanks to our work for the customers for which we provide consulting on OSS business models. I recently found a new post on this by Bruno Von Rotz, with some preliminary conclusions like “total value of USD 100 to 150 billion.. I would assume that some of it comes from enterprises and large organizations, but this is probably max 20-30% of it.”
I would like to provide first of all a validation of the first part, and a comment on the second. As for the software market, Gartner published in 2006 a very well done study on OSS in the context of the overall software market, and among the various results there is one that I found quite interesting:
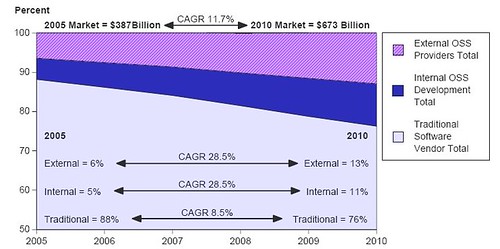
Considering the fact that some parallel data points (like results from the OECD estimates on software market) more or less confirm the predictions from Gartner, we can say that OSS has a financial value of 120B$ now, and will reach 150B$ in 2010, perfectly in line with the predictions from Bruno.
What I am not convinced is the calculation of the share 0f voluntary contributions Vs. company contributions. If Gartner data is accurate (and I believe that this is the case) we can expect that companies should contribute between 40% and 50% of value to a project; and this is somewhat consistent with projects like Linux or Eclipse where there is a large ecosystem, not only of adopters but of commercial companies working on top, and where company contributions are in that range. In this sense, I believe the 20%-30% percentage mentioned by Bruno to be too restrictive; the problem is that measuring code is not the only way to measure contributions. I use frequently this as an example:
“In the year 2000, fifty outside contributors to Open Cascade provided various kinds of assistance: transferring software to other systems (IRIX 64 bits, Alpha OSF), correcting defects (memory leaks…) and translating the tutorial into Spanish, etc. Currently, there are seventy active contributors and the objective is to reach one hundred. These outside contributions are significant. Open Cascade estimates that they represent about 20 % of the value of the software.”
Do these contributions appear as source code? No, exactly as localization efforts for OpenOffice or KDE do not appear in source code metrics. My belief is that the value of OSS right now is even much larger than 120B$, and that we have simply no way to measure this “hidden” value- but it’s there.
Our definitions of OSS-based business models
Posted by cdaffara in OSS business models, OSS data on March 13th, 2009
Two days ago, Matthew Aslett was so kind to comment on our new research on OSS business models; especially our new taxonomy, based on our latest extensions of the FLOSSMETRICS methodology and the increase in the number of surveyed companies. We both share the interest in having a clear, simple and usable set of definitions to avoid confusion when referring to specific business models; and he decided to publish the (previously private) set of definitions that were adopted in the CAOS report “Open source is not a business model“. As I would like to find a converging set of definitions, I will publish here a pre-release of our next edition of the OSS guide, that covers in more detail what Lampitt classify as “vendor licensing strategy”. My hope is to see if it is possible to find an agreed-to definition, that can be shared by researchers and experts. As already mentioned in my previous post, we introduced several changes compared to the previous edition:
- It does, for the first time, disaggregate what was originally called ITSC (Installation, training, support, consulting) because many successful companies are now specializing in a single activity. This is a significant change from 2006 (when we started collecting data on OSS models), when companies were performing in a more or less undifferentiated way all those activities. We believe that this “specialization” will continue with the enlargement of the commercial OSS market.
- We removed the “badgeware” category from the list. We found that some of the vendors that originally followed this model disappeared, and for those remaining protection from freeriding and overall model was more or less morphed into a “open core” or “split oss/commercial”. As the visibility clause can now be included in the GPLv3, I believe that the remaining few badgeware licenses will disappear quickly.
- As for our missing model (proprietary built on open) we found that basically the majority of products use OSS inside, so we are waiting to finish our second strand of research, on how to separate those products that are entirely OSS based from those that merely “use” OSS; our current idea is related to the “substitution principle”: is it possible to market the same product when all OSS components are substituted by non-OSS ones? Does it falls in the same market, or it becomes something radically different? This is a common theme, that tries to answer questions like “would it have been possible for Google to be based on proprietary software?”
Taking this into consideration, here is our new taxonomy:
- Dual licensing: the same software code distributed under the GPL and a commercial license. This model is mainly used by producers of developer-oriented tools and software, and works thanks to the strong coupling clause of the GPL, that requires derivative works or software directly linked to be covered under the same license. Companies not willing to release their own software under the GPL can buy a commercial license that is in a sense an exception to the binding clause; by those that value the “free as in speech” idea of free/libre software this is seen as a good compromise between helping those that abide to the GPL and receive the software for free (and make their software available as FLOSS) and benefiting through the commercial license for those that want to maintain the code proprietary. The downside of dual licensing is that external contributors must accept the same licensing regime, and this has been shown to reduce the volume of external contributions (that becomes mainly limited to bug fixes and small additions).
- Open Core (previously called split OSS/commercial): this model distinguish between a basic FLOSS software and a commercial version, based on the libre one but with the addition of proprietary plugins. Most companies adopt as license the Mozilla Public License, as it allows explicitly this form of intermixing, and allows for much greater participation from external contributions, as no acceptance of double licensing is required. The model has the intrinsic downside that the FLOSS product must be valuable to be attractive for the users, but must also be not complete enough to prevent competition with the commercial one. This balance is difficult to achieve and maintain over time; also, if the software is of large interest, developers may try to complete the missing functionality in a purely open source way, thus reducing the attractiveness of the commercial version.
- Product specialists: companies that created, or maintain a specific software project, and use a pure FLOSS license to distribute it. The main revenues are provided from services like training and consulting (the “ITSC” class) and follow the original “best code here” and “best knowledge here” of the original EUWG classification. It is based on the assumption, commonly held, that the most knowledgeable experts on a software are those that have developed it, and this way can provide services with a limited marketing effort, by leveraging the free redistribution of the code. The downside of the model is that there is a limited barrier of entry for potential competitors, as the only investment that is needed is in the acquisition of specific skills and expertise on the software itself.
- Platform providers: companies that provide selection, support, integration and services on a set of projects, collectively forming a tested and verified platform. In this sense, even Linux distributions were classified as platforms; the interesting observation is that those distributions are licensed for a significant part under pure FLOSS licenses to maximize external contributions, and leverage copyright protection to prevent outright copying but not “cloning” (the removal of copyrighted material like logos and trademark to create a new product). The main value proposition comes in the form of guaranteed quality, stability and reliability, and the certainty of support for business critical applications.
- Selection/consulting companies: companies in this class are not strictly developers, but provide consulting and selection/evaluation services on a wide range of project, in a way that is close to the analyst role. These companies tend to have very limited impact on the FLOSS communities, as the evaluation results and the evaluation process are usually a proprietary asset.
- Aggregate support providers: companies that provide a one-stop support on several separate OSS products, usually by directly employing developers or forwarding support requests to second-stage product specialists.
- Legal certification and consulting: these companies do not provide any specific code activity, but provide support in checking license compliance, sometimes also providing coverage and insurance for legal attacks; some companies employ tools for verify that code is not improperly reused across company boundaries or in an improper way.
- Training and documentation: companies that offer courses, online and physical training, additional documentation or manuals. This is usually offered as part of a support contract, but recently several large scale training center networks started offering OSS-specific courses.
- R&D cost sharing: A company or organization may need a new or improved version of a software package, and fund some consultant or software manufacturer to do the work. Later on, the resulting software is redistributed as open source to take advantage of the large pool of skilled developers who can debug and improve it. A good example is the Maemo platform, used by Nokia in its Mobile Internet Devices (like the N810); within Maemo, only 7.5% of the code is proprietary, with a reduction in costs estimated in 228M$ (and a reduction in time-to-market of one year). Another example is the Eclipse ecosystem, an integrated development environment (IDE) originally open sourced by IBM and later managed by the Eclipse Foundation. Many companies adopted Eclipse as a basis for their own product, and this way reduced the overall cost of creating a software product that provides in some way developer-oriented functionalities. There is a large number of companies, universities and individual that participate in the Eclipse ecosystem; as an example:
 As recently measured, IBM contributes for around 46% of the project, with individuals accounting for 25%, and a large number of companies like Oracle, Borland, Actuate and many others with percentages that go from 1 to 7%. This is similar to the results obtained from analysis of the Linux kernel, and show that when there is an healthy and large ecosystem the shared work reduces engineering cost significantly; Gosh estimates that it is possible to obtain savings in terms of software research and development of 36% through the use of FLOSS; this is, in itself, the largest actual “market” for FLOSS, as demonstrated by the fact that the majority of developers are using at least some open source software within their own code.
 - Indirect revenues: A company may decide to fund open source software projects if those projects can create a significant revenue source for related products, not directly connected with source code or software. One of the most common cases is the writing of software needed to run hardware, for instance, operating system drivers for specific hardware. In fact, many hardware manufacturers are already distributing gratis software drivers. Some of them are already distributing some of their drivers (specially those for the Linux kernel) as open source software.
The loss-leader is a traditional commercial model, common also outside of the world of software; in this model, effort is invested in an open source project to create or extend another market under different conditions. For example, hardware vendors invest in the development of software drivers for open source operating systems (like Linux) to extend the market of the hardware itself. Other ancillary models are for example those of the Mozilla foundation, that obtains a non trivial amount of money from a search engine partnership with Google (an estimated 72M$ in 2006), while SourceForge/OSTG receives the majority of revenues from ecommerce sales of the affiliate ThinkGeek site.
At the moment there is no “significant” model, with companies more or less adopting and changing model depending on the specific market or the shifting costs. For example, during the last few years a large number of companies shifted from an “open core” model to a pure “product specialist” one to leverage the external community of contributors. Many researchers are trying to identify whether there is a more “efficient” model among all those surveyed; what we found is that the most probable future outcome will be a continuous shift across model, with a long-term consolidation of development consortia (like Symbian and Eclipse) that provide strong legal infrastructure and development advantages, and product specialists that provide vertical offerings for specific markets.
Comparing companies effectiveness: a response to Savio Rodrigues
Posted by cdaffara in OSS business models, OSS data, Uncategorized on March 9th, 2009
I was intrigued by a twit from Stéfane Fermigier, “Comparing only 1 oss vendor (RHAT) and 1 proprietary, monopolistic one (MSFT) is really a deep piece of economic science !” with a link to this article by long-time OSS debater/supporter/critic/fellow, Savio Rodrigues, that compares the financial breakdown of RedHat and Microsoft, and concludes that the commonly-held hypothesis that open source gives a capital advantage by providing savings on R&D is not true. In particular: “The argument is that commercial vendors spend on items such as advertising, marketing, R&D and most importantly, expensive direct sales representatives. We’re told that open source vendors spend significantly less on these items, and hence can be more capital efficient. These costs make up the difference between the costs of doing business as a commercial vendor vs. an open source vendor. Somehow, those numbers didn’t seem right to me.”
I am always skeptical of the “We’re told” part, as I also remember the “we’re told that all open source is developed by students in basements”, “we’re told that we can give the source code and people will start work on it” and many other, unsubstantiated or out-of-context comments.
I would like to point out a few things:
- first of all, there are structural limits in how public listed companies can perform, and how the financial breakdown is performed. If Savio tried to extend his (somewhat limited) analysis to other public companies in the same sector he would have found that most of them are nearly identical in R&D versus SG&A costs, when compared within the same class in terms of market capitalisation. In fact, only startups (that rarely can go to the stock market) have an higher-than-average R&D. Other companies with similar properties are companies in the biochemistry and drug design firms, that have a long incubation period to create a product, and for this reason have a high R&D share.
- Then, the balance sheet is in itself not a good way to measure the “productivity”, or savings in development compared to same-class companies. In fact, as I wrote some days ago, savings due to the adoption of OSS are not inherently visible in balance sheets, but appear as better quality product or as the capability of producing goods at a lower price point. In fact, just thinking of comparing RedHat with a company that is 55 times larger should provide an idea of how big an advantage is OSS in terms of efficiency.
- Many companies are helped by the existence of a “trialable” product, and in this sense there may be a core of truth in the idea that cost for customer acquisition may be lower. I am not convinced that cost reduction is so significant, at least not to the same extent of R&D advantages that are clearly easier to measure, and that tend to be significant.
I agree with Savio that competition should not happen exclusively on pricing (but it may be a part of a larger strategy), but I contend that by looking just at two balance sheet breackdowns can give us information on whether OSS is more or less efficient in terms of product creation. I continue to believe that in many markets OSS provides a substantial advantage: after all, Rishab et al. estimated the average R&D advantage at 36%; my estimates are from 20% to 75% in specific industrial areas, but in any case substantial.
update: Savio added another company (Tibco) which is similar to RedHat size; as before, it shows very similar results. It is my belief that even adding additional companies will more or less show that for software-intensive companies the results will be more or less the same. I also believe that the real comparison should happen outside the financial sheets, by comparing the market: in which markets do the company compete? What is the average size of the competitors? If we can show that on average OSS companies tend to be efficient competitors in markets much larger than their own, then we can show that OSS can give an advantage. If Rishab’s evaluation is right, the 36% increased efficiency should bring the equivalent of a capital advantage of 50% (roughly) so we should check whether RedHat or Alfresco effectively compete with companies that are at least 50% larger than themselves.
Rethinking OSS business model classifications by adding adopters’ value
Posted by cdaffara in OSS business models, OSS data on March 6th, 2009
As a follow-up to our previous research in FLOSSMETRICS and OpenTTT, we are trying to improve our original classification, adapting it to the many changes that are happening in the commercial open source world. As a preliminary result, I would like to share with you the preliminary second version of our OSS model taxonomy, that includes a few relevant changes:
- It does, for the first time, disaggregate what was originally called ITSC (Installation, training, support, consulting) because many successful companies are now specializing in a single activity. This is a significant change from 2006 (when we started collecting data on OSS models), when companies were performing in a more or less undifferentiated way all those activities. We believe that this “specialization” will continue with the enlargement of the commercial OSS market.
- We removed the “badgeware” category from the list. We found that some of the vendors that originally followed this model disappeared, and for those remaining protection from freeriding and overall model was more or less morphed into a “open core” or “split oss/commercial”. As the visibility clause can now be included in the GPLv3, I believe that the remaining few badgeware licenses will disappear quickly.
- We have added an experimental section, related to the advantages for the vendor and for the adopters of OSS models. This section is in my opinion quite important in making this a sort of “cheatsheet” for companies that will be interested in using an OSS business model in the future, but is still subject to some revision. I would be grateful for any suggestion or correction to it.
Anyway, here is a link to the table in ODS format, and in html format:
From theory to practice: the personal desktop linux experiment
Posted by cdaffara in OSS business models, OSS data, blog on March 3rd, 2009
In my previous post, I tried to provide a simple theoretical introduction to the UTAUT technology adoption model, and the four main parameters that govern the probability of adoption; as a complement, I will present here a small demonstration on how to use the model to improve the adoption of a specific technology, that is the user-chosen personal computer with Linux as single operating system. The reason for the “user-chosen” is related to the different adoption processes for personal computers in a personal setting (for example hobbyist, student, micro-enterprise) versus the business or public authority environment- those will be discussed in a future post. The idea for this experiment came out of a workshop I held in Manila, where I had the pleasure to discuss with the technical manager of the largest PC chain in the Philippines about how to best introduce a Linux PC into the market.
To set the context: we will present an example of an optimization exercise for the take-up of a Linux-based PC, to be distributed and used mainly for personal purposes, and acquired through direct channels like large distribution networks, computer reseller chains, individual stores. The first important point is related to the market: there are really two separate transactions, the first one from the computer manufacturer to the chain and the second from the chain to the individual users. The two markets are distinct, and have widely differing properties:
- from manufacturer to chain: there is a small number of legal agreements (the reseller/redistribution agreements), the main driver for the manufacturer is to acquire volume, while the chain is interested in profit margins for the single sale and overall volume (how fast the stock can be moved), and sales of complimentary products
- from chain to users: there is a large number of very small transactions; the main driver for the chain is to get as much margin on aggregate sales as possible (think selling the PC, the printer and associated consumables) while the buyer is looking for a specific set of functionalities at a reasonable price, like being able to browse the web, using email, writing letters and such.
What is useful for the first transaction may be useless for the second; the fundamental idea is that both transactions have to happen and be sustainable for the market to be self-sustaining and long running (a short-running market may even be negative- if a chain start selling a model and discontinues it after a little while, the end users may believe that it is no longer sold because of defects or because it was not competitive. Think for a moment about the comments after WalMart stopped selling in store the very low cost Linux PC (that is still offered online); despite the fact that no real quality issues was found, most commentators associated the end of the experiment with a general failure for Linux PCs.(as for the source of the reference to quality issues, it is extracted from the Comes-vs-Microsoft documents related to WalMart: “We understand that there has not been a customer satisfaction issue. WalMart sets fairly strict standards for customer return rates and service calls”).
So, our optimization experiment need to satisfy two constraints: guarantee a margin (eventually compounded from accessory sales) on every sale, guarantee low inventory (fast turnaround), and this means that adopters should buy with a high probability after first or second sight. Let’s recall the four parameters for adoption, and apply them for the specific situation:
- performance expectancy: is this PC fast? is it able to perform the tasks that I need?
- effort expectancy: is it easy to use?
- social influence: is it appropriate for me to use? to be shown buying it? what my peers will say when I will show it?
- facilitating conditions: is there someone that will help me in using it? will it work with my network?
Let’s start with performance expectancy. Most “Linux pc” are really very low cost, substandard machines, assembled with the overall idea that price is the only sensitive point. In this sense, while true that Linux and open source allows for far greater customizability and speed it is usually impossible to compensate for extreme speed differences; this means that to be able to satisfy the majority of users, we cannot aim for “the lowest possible price”. A good estimate of the bill of materials is the median of the lowest quartile of the price span of current PC in the market (approximately, 10% to 20% more than the lowest price). After the hardware is selected, our suggestion is to use a standard linux distribution (like Ubuntu) and add to it any necessary component that will make it work out of the box. Why a standard distribution? Because this way users will have not only a potential community of peers to ask for help, but the cost of maintaining it will be spread – as an example, most tailor-made Linux distributions for NetBooks are not appealing because they employ old version of software packages. This provides an explanation of why Dell had so much success in selling Linux netbooks compared to other vendors, with one third of the netbooks sold with plain Ubuntu. Having a standard distribution reduces costs for the technology provider, provides a safety mechanism for the reseller chain (that is not dependent on a single company) and provides the economic advantage of a cost-less license, that increase the chain margin.
Effort expectancy: what is the real expectancy of the user? Where do the user obtains his informations from? The reality is that most potential adopters get their information from peers, magazines and in many cases from in-store exploration and talks with store clerks. The clear preference that most users demonstrate towards Windows really comes from a rational reasoning based on incomplete information: the user wants to use the PC to perform some activites, he knows that to perform such activities software is needed, he knows that Windows has lots of software, so Windows is a safe bet. The appearance of Apple OS X demonstrated that this reasoning can be modified, for example by presenting a nicer user experience; OS X owners get in contact with other potential adopters, are shown a different environment that seems to be capable of performing the most important talks, and so the diffusion process can happen. For the same process to be possible with Linux, we must improve the knowledge of users, to show them that normal use is no more intimidating than that of Windows, and that software is available for the most common tasks.
This requires two separate processes: one to show that the “basic” desktop is capable of performing traditional tasks easily, and another to show what kind of software is available. My favourite way for doing this for in-store experiences is through a demo video, usually played in continuous rotation, that shows some basic activities: for example, how Network Manager provides a simple, one-click way to connect to WiFi, or how Nautilus provides previews of common file formats. There should be a fast, 5-minute section to show that basic activities can be performed easily. I prefer the following list:
- web browsing (showing compatibility with sites like FaceBook, Hi5, Google Mail)
- changing desktop properties like backgrounds or colours
- connecting to WiFi networks
- printer recognition and setup
- package installation
I know that Ubuntu (or OpenSUSE, or Fedora) users will complain that those are functionalities that are nowadays taken for granted. But consider what even technical journalist sometimes may write about Linux: “It booted like a real OS, with the familiar GUI of Windows XP and its predecessors and of the Mac OS: icons for disks and folders, a standard menu structure, and built-in support for common hardware such as networks, printers, and DVD burners.”
Booted like a real OS. And - icons!
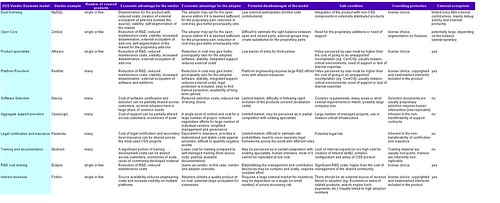
So much for the change in perspective, like the Vista user perception problem demonstrated. So, a pictorial presentation is a good media to provide an initial, fear-reducing informative presentation that will not require assistance from the shop staff. On the same side, a small informative session may be prepared (we suggested a 8-page booklet) for the assistants to provide answers comparable to that offered for Windows machines. Usability of modern linux distribution is actually good enough to be comparable to that of Windows XP on most tasks. In a thesis published in 2005, the following graph was presented, using data from previous work by Relevantive:
The time and difficulty of tasks was basically the same; most of the problems that were encountered by users were related to bad naming of the applications: “The main usability problems with the Linux desktop system were clarity of the icons and the naming of the applications. Applications did not include anything concerning their function in their name. This made it really hard for users to find the right application they were looking for.” This approach was substantially improved in recent desktop releases, adding a suffix to most applications (for example, “GIMP image editor” instead of “GIMP”). As an additional result, the following were the subjective questionnaire results:
- 87% of the Linux test participants enjoyed working with the test system (XP: 90%)
- 78% of the Linux test participants believed they would be able to deal with the new system quickly (XP: 80%).
- 80% of the Linux test participants said that they would need a maximum of one week to achieve the same competency as on their current system (XP: 85%).
- 92% of the Linux test participants rated the use of the computers as easy (XP: 95%).
This provides evidence than, when properly presented, a Linux desktop can provide a good end-user experience.
The other important part is related to applications: two to five screenshots for every major application will provide an initial perception that the machine is equally capable of performing the most common tasks; and equally important is the fact that such applications need to be pre-installed and ready to use. And with ready to use, I mean with all the potential enhancements that are available but not installed, like the extended GIMP plugin collection that is available under Ubuntu as gimp-plugin-registry, or the various thesauri and cliparts for OpenOffice.org. A similar activity may be performed with regards to games, that should be already installed and available for the end user. Some installers for the most requested games may be added using wine (through a pre-loader and installer like PlayOnLinux); we found that in recent Wine builds performance is quite good, and in general better than that of proprietary repackaging like Cedega.
One suggestion that we added is to have a separate set of repository from which to update the various packages, to allow for pre-testing of package upgrades before they reach the end users. This, for example, would allow for the creation of alternate packages (outside of the Ubuntu main repositories) that guarantee the functionality of the various hardware part even if the upstream driver changes (like it recently happened with the inclusion of the new Atheros driver line in the kernel, that complicated the upgrade process for netbooks with this kind of hardware chipset). The cost and complexity of this activity is actually fairly low, requiring mainly bandwidth and storage (something that in the time of Amazon and cloud computing has a much lower impact) and limited human intervention.
The next variable is social acceptance, and is much more nuanced and difficult to assess; it also changes in a significant way from country to country, so it is more difficult for me to provide simple indications. One aspect that we found quite effective is the addition, on the side of the machine, of a simple hologram (similar to that offered by proprietary software vendor) to indicate a legitimate origin of the software. We found that a significant percentage of potential users looked actually in the back or the side of the machine to see if such a feature was present, fearing that the machine could possibly be loaded with pirated software. Another important aspect is related to the message that is correlated to the acquisition: one common error is to mark the machine as “the lowest cost”, a fact that provides two negative messages: the fact that the machine is somehow for “poors”, and the fact that value (a complex, multidimensional variable) is collapsed only on price, making it difficult to provide the message that the machine is really more about “value for money” than “money”. This is similar to how Toyota invaded the US car market, by focusing both on low cost and quality, and making sure that value was perceived in every moment of the transaction, from when the potential customer entered the show room to when the car was bought. In fact, it would be better to have a combined pricing that is slightly higher than the lowest possible price, to make sure that there is a psychological “anchoring”.
While price sensitive users are, along with “enthusiasts”, those that up to now drove the adoption of Linux on the desktop, it is necessary to extend this market to the more general population; this means that purely “price-based” approaches are not effective anymore.
As for the last aspect, facilitating conditions, the main hurdle perceived is the lack of immediate assistance by peers (something that is nearly guaranteed with Windows, thanks to the large installed base). So, a feature that we suggested is the addition of an “instant chat” icon on the desktop to ask for help, and brings back a set of web pages with some of the most commonly asked questions and links to online fora. The real need for such a feature is somehow reduced by the fact that the hardware is preintegrated and that pre-testing is performed before package update, but is a powerful psychological reassurance, and should receive a central point in the desktop. Equally important the inclusion of non-electronic documentation, that allows for easy “browsing” before the beginning of a computing session. A very good example is the linux starter pack, an introductory magazine-like guide that can be considered as an example.
We discovered that plain, well built Linux desktops are generally well accepted, with limited difficulties; most users after 4weeks are proficient and generally happy of their new user environment.
The dynamics of OSS adoptions, II – diffusion processes
Posted by cdaffara in OSS business models, OSS data, Uncategorized on February 27th, 2009
(followup post of “the dynamics of OSS adoption – 1“)
The most common process behind OSS adoption is called “diffusion”, and is usually modelled using a set of differential equations. It is based on the idea that the market is made of a set of interoperating agents, each one deciding independently which technology to adopt in different moments; the model is usually capable of handling multiple participants in a market, and to predict overall evolution. A good example of a diffusion-based dynamic equilibrium is the web server market, when total server numbers are used. If we take the data from Netcraft, and we model each individual server type as a competitor, we got this kind of graph:
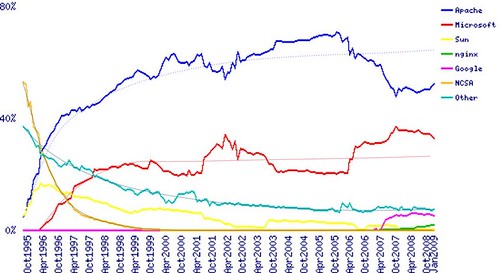
Which is consistent with a traditional Bass Model explanation (data for apache was added to that of Google Web server, that is Apache-based; bicubic smoothing was used to get the trend lines). Diffusion models tend to generate this kind of equilibrium lines, with the market that in a more or less consistent way moves to an equilibrium that changes only when a specific technology is substituted by moving to another, different status.
The probability of choosing one technology over the other depends on several factors; a very good model for such adoption is the UTAUT model (some pdf examples here and here), that was found capable of predicting 70% of the variance of adoption success (what it means: that the parameters in the model explain nearly perfectly whether you will adopt a technology or not).
The important point to remember: this is about *individual* adoption, not mandated and without external constraints. In this sense, we can use it to predict how a PC owner chooses her web browser, or how a small company may choose which web server to use.
The model uses four parameters: performance expectancy, effort expectancy, social influence, and facilitating conditions.
- performance expectancy: The degree to which a person believes that using a particular system would enhance his or her job performance, or the degree to which using an innovation is perceived as being better than using its precursor.
- effort expectancy: the degree to which a person believes that using a system would be free of effort, or the degree to which a system is perceived as relatively difficult to understand and use.
- social influence: The individual’s internalization of the reference group‘s subjective culture, and specific interpersonal agreements that the individual has made with others, in specific social situations; or the degree to which use of an innovation is perceived to enhance one‘s image or status in one‘s social system.
- facilitating conditions: Reflects perceptions of internal and external constraints on behaviour and encompasses self-efficacy, resource facilitating conditions, and technology facilitating conditions; or objective factors in the environment that observers agree make an act easy to do, including the provision of computer support.
In the next post, I will present an example of these four parameters in the context of an OSS adoption.